Praktikum: Diagramme 6
Question
Solution
Short
Video
\(\LaTeX\)
No explanation / solution video to this exercise has yet been created.
Visit our YouTube-Channel to see solutions to other exercises.
Don't forget to subscribe to our channel, like the videos and leave comments!
Visit our YouTube-Channel to see solutions to other exercises.
Don't forget to subscribe to our channel, like the videos and leave comments!
Exercise:
Tabelle reftab:SoftBallQuetsch zeigt Kraft-Kompression Messungen an einem Softball. a Stellen sie die gemessene Kraft F als Funktion der Kompression y dar. Zeichnen Sie auch Fehlerbalken. b Bestimmen Sie die `Federkonstante' im Bereich wo das hookesche Federgesetz gilt. Zeichnen Sie die Regressionsfunktion zu den Daten. c Nach der Theorie der elastischen Deformation von Kugeln H. Hertz würde man Fpropto y^/ erwarten. Führen Sie eine passe Regression durch. Zeichnen Sie die Funktion und beurteilen Sie ob die Funktion passt.
Solution:
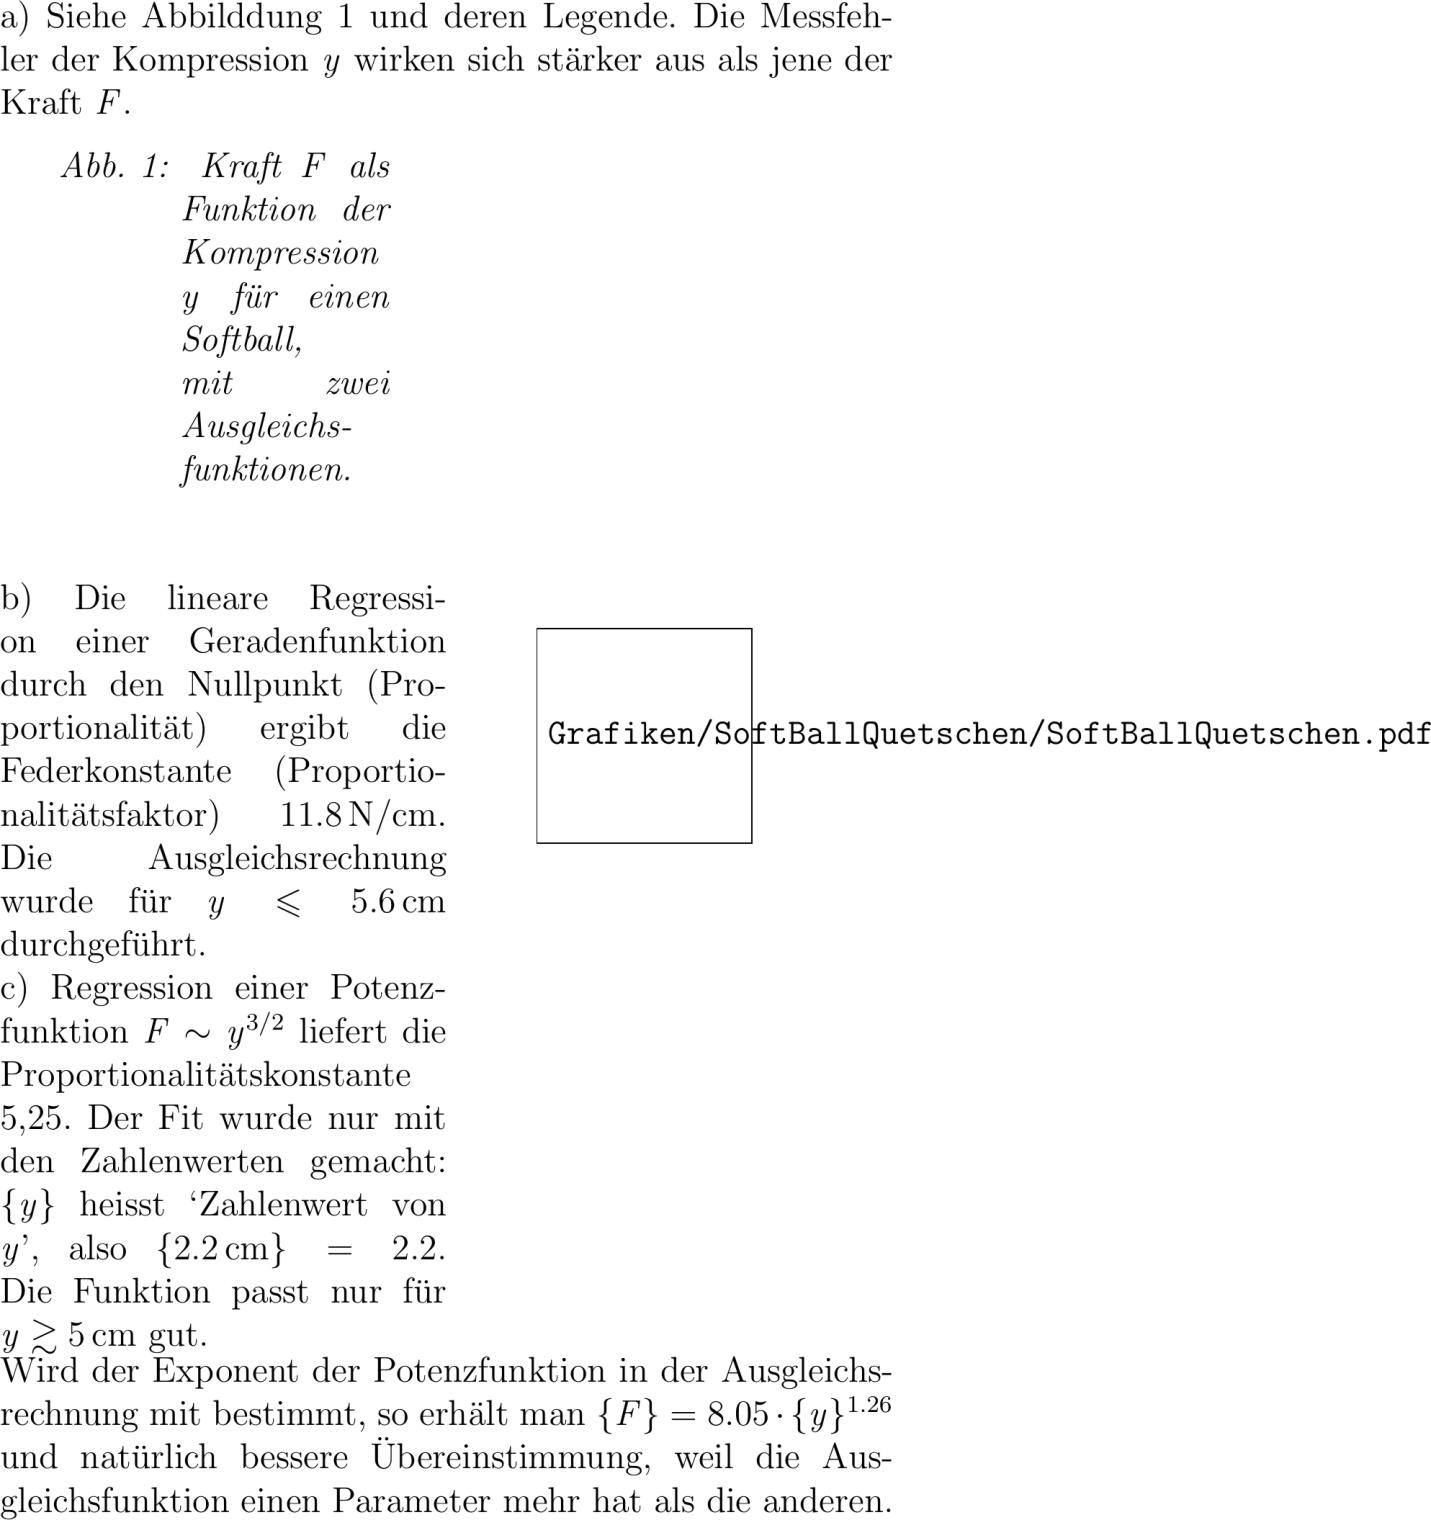
% . Oktober Lie. a Siehe Abbilddung reffig:SoftBallQuetschen und deren Lege. Die Messfehler der Kompression y wirken sich stärker aus als jene der Kraft F. minipage.textwidth captlabelfig:SoftBallQuetschen Kraft F als Funktion der Kompression y für einen Softball mit zwei Ausgleichsfunktionen. vspacecm b Die lineare Regression einer Geradenfunktion durch den Nullpunkt Proportionalität ergibt die Federkonstante Proportionalitätsfaktor .siN/cm. Die Ausgleichsrechnung wurde für y leqslant .sicm durchgeführt. c Regression einer Potenzfunktion F propto y^/ liefert die Proportionalitätskonstante . Der Fit wurde nur mit den Zahlenwerten gemacht: y heisst `Zahlenwert von y' also .sicm .. Die Funktion passt nur für y gtrsim sicm gut. minipage hfill minipage.textwidth includegraphicsGrafiken/SoftBallQuetschen/SoftBallQuetschen.pdf minipage Wird der Exponent der Potenzfunktion in der Ausgleichsrechnung mit bestimmt so erhält man F . y ^. und natürlich bessere Übereinstimmung weil die Ausgleichsfunktion einen Parameter mehr hat als die anderen. newpage figureH includegraphicswidthtextwidth#image_path:SoftBallQuetschen# caption labelfig:SoftBallQuetschen figure
Tabelle reftab:SoftBallQuetsch zeigt Kraft-Kompression Messungen an einem Softball. a Stellen sie die gemessene Kraft F als Funktion der Kompression y dar. Zeichnen Sie auch Fehlerbalken. b Bestimmen Sie die `Federkonstante' im Bereich wo das hookesche Federgesetz gilt. Zeichnen Sie die Regressionsfunktion zu den Daten. c Nach der Theorie der elastischen Deformation von Kugeln H. Hertz würde man Fpropto y^/ erwarten. Führen Sie eine passe Regression durch. Zeichnen Sie die Funktion und beurteilen Sie ob die Funktion passt.
Solution:
% . Oktober Lie. a Siehe Abbilddung reffig:SoftBallQuetschen und deren Lege. Die Messfehler der Kompression y wirken sich stärker aus als jene der Kraft F. minipage.textwidth captlabelfig:SoftBallQuetschen Kraft F als Funktion der Kompression y für einen Softball mit zwei Ausgleichsfunktionen. vspacecm b Die lineare Regression einer Geradenfunktion durch den Nullpunkt Proportionalität ergibt die Federkonstante Proportionalitätsfaktor .siN/cm. Die Ausgleichsrechnung wurde für y leqslant .sicm durchgeführt. c Regression einer Potenzfunktion F propto y^/ liefert die Proportionalitätskonstante . Der Fit wurde nur mit den Zahlenwerten gemacht: y heisst `Zahlenwert von y' also .sicm .. Die Funktion passt nur für y gtrsim sicm gut. minipage hfill minipage.textwidth includegraphicsGrafiken/SoftBallQuetschen/SoftBallQuetschen.pdf minipage Wird der Exponent der Potenzfunktion in der Ausgleichsrechnung mit bestimmt so erhält man F . y ^. und natürlich bessere Übereinstimmung weil die Ausgleichsfunktion einen Parameter mehr hat als die anderen. newpage figureH includegraphicswidthtextwidth#image_path:SoftBallQuetschen# caption labelfig:SoftBallQuetschen figure